From Passion to Profession
  • Home
  • Notes
  • Projects
  • Resources
    • Discovery Log
    • Books I Read
    • Blogs I Visit
    • Tools I Use
  • Home
  • Notes
  • Projects
  • Resources
    • Discovery Log
    • Books I Read
    • Blogs I Visit
    • Tools I Use

Monitor Java Application with VisualVM

9/7/2013

0 Comments

 
It is not uncommon that you need to watch the runtime performance of a Java application on a server. In this post, I'll show you how to set up a target JVM so you can monitor its cpu, heap memory, threads usage from a specific JMX client - VisualVM. VisualVM is similar to JConsole, a JMX-compliant monitoring tool, but is more advanced. 


To use a JMX client, the setup you need to do first are:

  1. On the Target server where JVM runs, you need to enable JMX Agent for the JVM.
  2. On the local machine where you want to monitor your Java application from, you need a JMX client. For this post, I chose VisualVM.
  3. To prevent other JMX client from accessing your JMX Agent, you want to turn on authentication when your JMX client connects to your JMX Agent.

Enable JMX Agent for JVM

Your java runtime is not enabled with JMX by default unless you explicitly specify to turn it on. With JMX agent enabled, you can use a JMX Client to tap into your JVM to monitor its memory usage and performance at runtime. To enable JMX for a JVM, please refer to Enable JMX Agent for JVM.

Install VisualVM

VirtualVM is like JConsole, but it has more advanced monitoring features for developers:
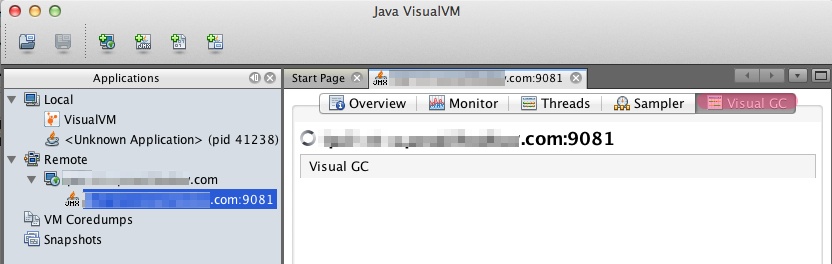
  • allowing the user to analyze thread execution
  • the ability to profile/sample CPU and memory usage
To install it on your local development machine, you can download it here. If you're like me as a Mac user, follow these steps:

  1. Download Mac OS X Application Bundle
  2. Double click on the downloaded VisualVM .dmg file.
  3. Drag VisualVM to Applications folder.

Connect to JMX Agent from VisualVM

To connect to a target server where JMX Agent is turned on with username and password required, from within VisualVM on your local machine, do these:
1. Select File > Add JMX Connection ...
2. Enter <server>:<port>
3. Enter controlRole or monitorRole as user, and the corresponding <password> as set up in the jmxremote.password file
If your target server where JMX Agent does not require username/password, just leave those blank when connecting.

VisualVM Quick Guide

To see what you usually see (cpu, classes, memory, etc.) as if you were using JConsole, double click on display name (e.g. controlRole or monitorRole) on the left panel as seen below:
Picture
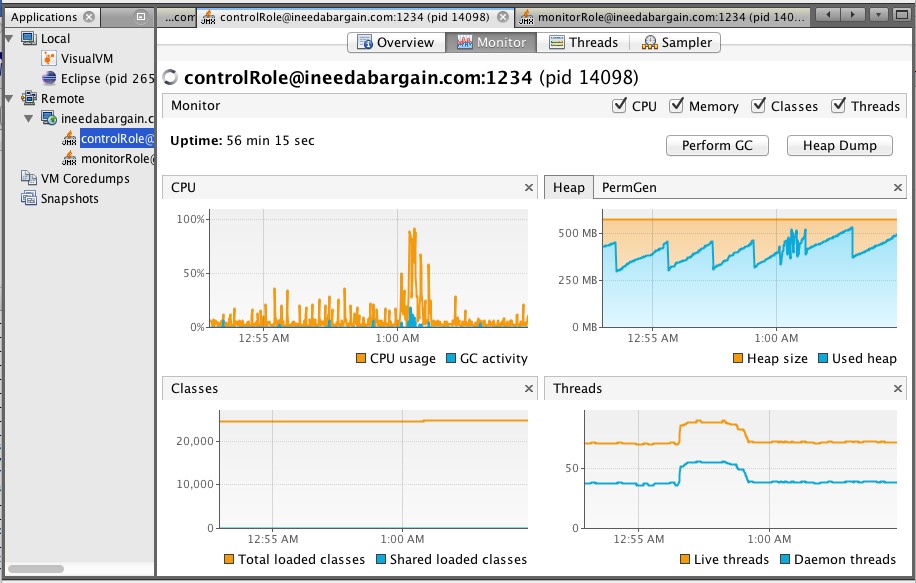
To generate Heap Dump on the Target JVM server, 
Select Monitor tab
Click Heap Dump
To analyze threads and profile CPU & memory:

Access JMX Agent as controlRole also allows you analyze threads and profile CPU & memory. To learn more about profiling/sampling using VisualVM, please see this article.

To analyze garbage collection (GC)
If you just want to visually get an idea about how often the major GC or minor GC took place, use JConsole which should be available under $JAVA_HOME/bin directory. On your mac, you can simply launch JConsole:
jconsole&
The following JConsole screen shows the app has been using up memory that major GC keeps happening.
Picture
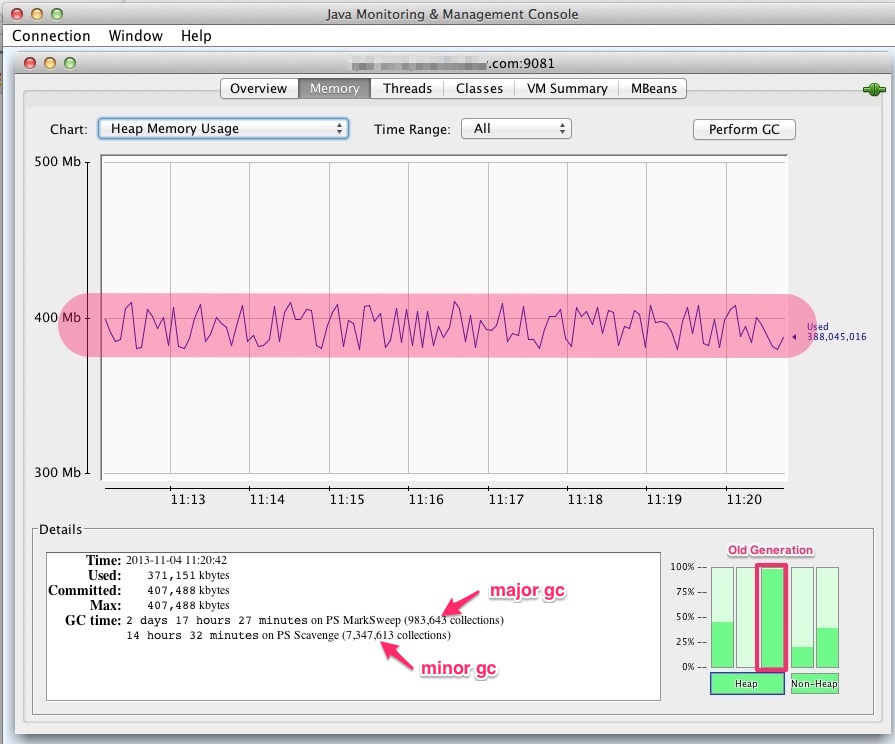
Similarly, you can use Visual GC plug-in for VisualVM. It requires jstatd on the server side. First install Visual GC plugin:

  1. Tools > Plugins > Settings
  2. Set Update Centers URL if necessary: https://visualvm.java.net/uc/6u23/updates.xml.gz
  3. Click Available Plugins tab, click Reload Catalog
  4. Select Visual GC, then Install
  5. Restart VisualVM, and you will see Visual GC tab
Picture
Alternatively, you may simply fall back on using JConsole to monitor memory usage, or consider to install GCViewer plug-in for VisualVM. 

References

  • Application Monitoring with JConsole, VisualVM and AppDynamics Lite
  • Monitoring and Management Using JMX Technology
  • VisualVM: Monitoring Remote JVM Over SSH (JMX Or Not)
0 Comments


Leave a Reply.

    Categories

    All
    Algorithm
    Concurrency
    CQ
    Data Structure
    Design Pattern
    Developer Tool
    Dynamic Programming
    Entrepreneur
    Functional Programming
    IDE
    Java
    JMX
    Marketing
    Marklogic
    Memory
    OSGI
    Performance
    Product
    Product Management
    Security
    Services
    Sling
    Social Media Programming
    Software Development

    Feed Widget

    Archives

    May 2020
    March 2020
    April 2018
    March 2018
    February 2018
    December 2017
    March 2017
    November 2016
    June 2016
    May 2016
    April 2016
    October 2015
    September 2015
    August 2015
    September 2014
    July 2014
    June 2014
    May 2014
    March 2014
    January 2014
    December 2013
    November 2013
    October 2013
    September 2013
    August 2013
    July 2013
    June 2013

    RSS Feed

in loving memory of my mother  and my 4th aunt
Photos from net_efekt, schani, visnup, Dan Zen, gadl, bobbigmac, Susana López-Urrutia, jwalsh, Philippe Put, michael pollak, oskay, Creative Tools, Violentz, Kyknoord, mobilyazilar