|
Ever suspect your Java app leaking memory but not sure which class it is potentially causing OOM? In this post, I recommend Eclipse Memory Analyzer (MAT) for developers to analyze heap dumps so you can chase down leak suspects. MAT is much easier to use and read than stand-along jhat unix command, and while monitor memory usage using VisualVM is helpful, MAT gives you specific hints about which classes may be the suspects. Install Memory Analyzer (MAT) Plugin for EclipseHelp > Install New Software Open Heap DumpTo open a heap dump file (.hprof), have the file be ready (named .hprof) and switch your Eclipse to Memory Analysis perspective: Make sure your heap dump is named with .hprof extension. then read a heap dump file into Eclipse, File > Open Heap Dump ... Increase Eclipse Memory AllocationOptionally, if you're trying to analyze a bigger .hprof (heap dump) than your Eclipse can handle: 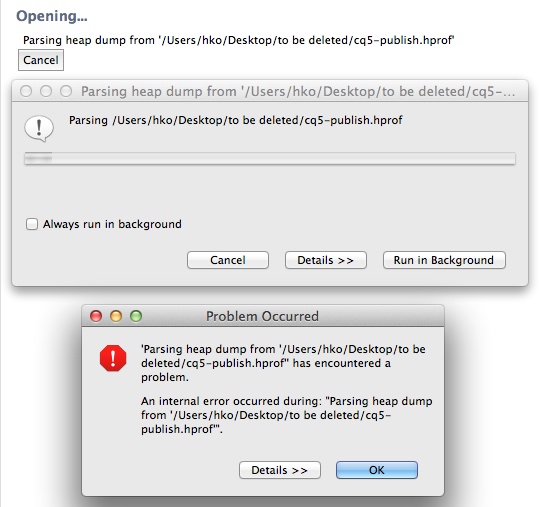 You need to increase the memory allocation of your Eclipse for running MAT. Since the .hprof is about 10GB in size, I took the following steps to allocate 10GB for my Eclipse on my Macbook Pro: Highlight Eclipse/GGTS app, right-click, select Show Package Contents Open a large .hprof may take a while. In my case, it took about 30 minutes on my Macbook Pro (8GB memory) to open a 10GB .hprof. Eventually, it did come up slowly but surely, whereas my colleague used jhat on a different machine failed to read in the same .hprof after 2 hours of efforts. Analyse Heap DumpRight after you successfully open a .hprof heap dump file, the overview tab will show with a pie chart. You can explore by hover over the pie chart, or under the chart, click to run histogram, dominator tree, top consumers, leak suspects, top components, component report. 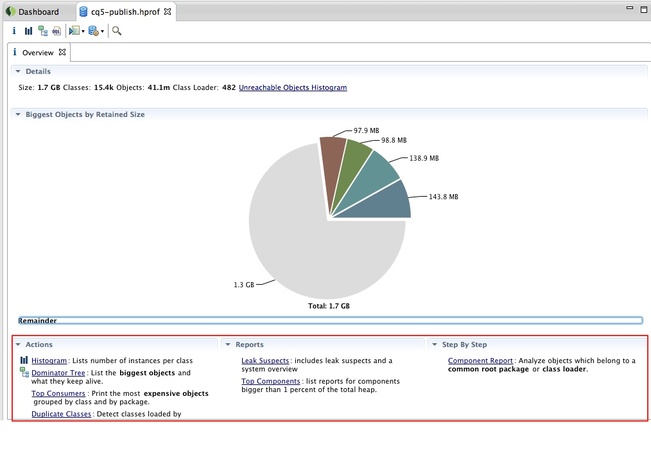 Every time you run a report, a .zip file is likely to be generated along side the .hprof file. The .zip file is the HTML version of the report you can sent to someone and have them view the report using a browser. 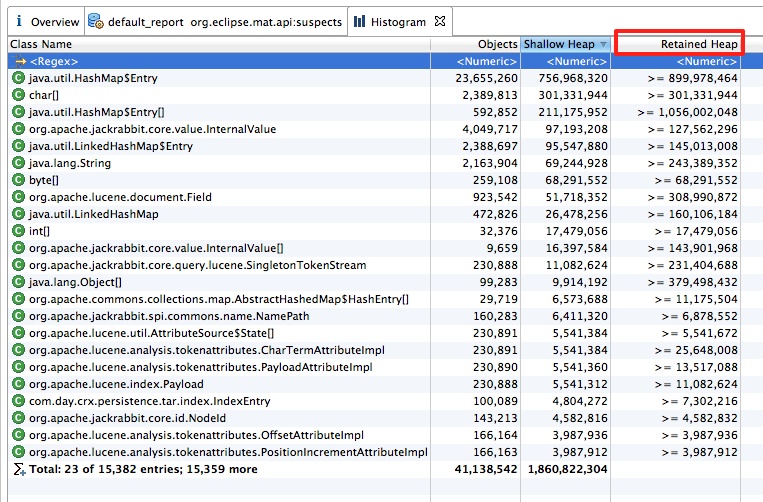 The above retained heap column of Histogram report shows the sum of the shallow heap size of all objects that would be removed when this object is garbage collected. It shows which class is taking up the majority of the memory. 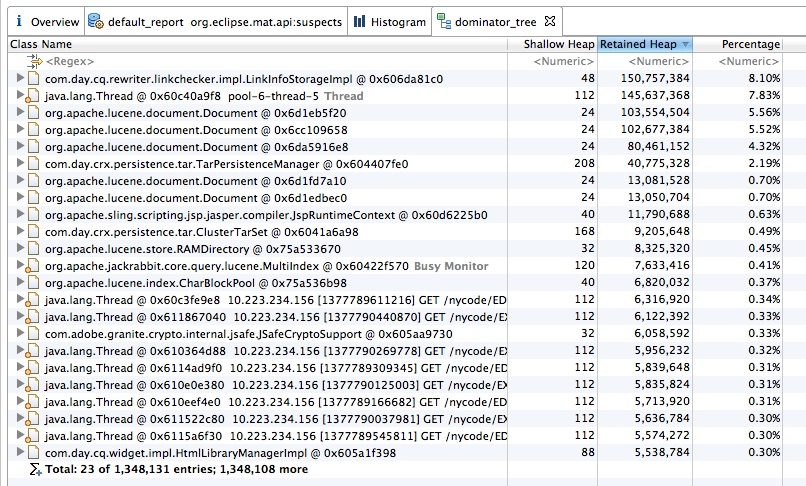 The key to understanding your retained heap, is looking at the dominator tree above. The dominator tree allows you to identify the largest memory graphs. An Object X is said to dominate an Object Y if every path from the Root to Y must pass through X. References
0 Comments
Leave a Reply. |
Categories
All
Archives
May 2020
|
 RSS Feed
in loving memory of my mother and my 4th aunt